|
Download Data (XLS File) |
|
|||||
|
|||||
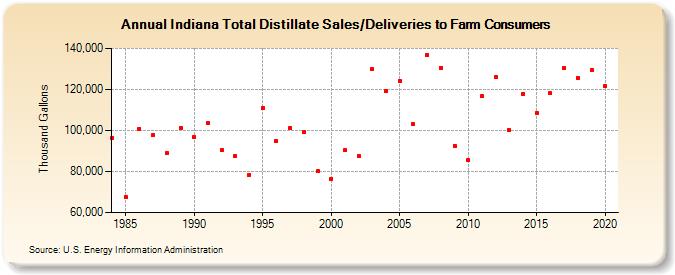
| Indiana Total Distillate Sales/Deliveries to Farm Consumers (Thousand Gallons) | |||||
| Decade | Year-0 | Year-1 | Year-2 | Year-3 | Year-4 | Year-5 | Year-6 | Year-7 | Year-8 | Year-9 |
|---|---|---|---|---|---|---|---|---|---|---|
| 1980's | 96,334 | 67,481 | 100,865 | 97,677 | 88,937 | 101,433 | ||||
| 1990's | 96,782 | 103,471 | 90,400 | 87,402 | 78,349 | 110,926 | 94,802 | 101,228 | 99,117 | 80,024 |
| 2000's | 76,566 | 90,329 | 87,329 | 129,943 | 118,994 | 124,304 | 102,971 | 136,874 | 130,573 | 92,504 |
| 2010's | 85,418 | 116,629 | 126,067 | 100,126 | 118,003 | 108,670 | 118,248 | 130,349 | 125,748 | 129,372 |
| 2020's | 121,535 |
| - = No Data Reported; -- = Not Applicable; NA = Not Available; W = Withheld to avoid disclosure of individual company data. |
| Release Date: 2/9/2022 |
| Next Release Date: Suspended |