|
Download Data (XLS File) |
|
|||||
|
|||||
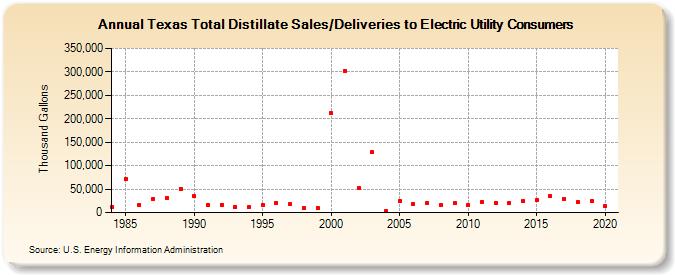
| Texas Total Distillate Sales/Deliveries to Electric Utility Consumers (Thousand Gallons) | |||||
| Decade | Year-0 | Year-1 | Year-2 | Year-3 | Year-4 | Year-5 | Year-6 | Year-7 | Year-8 | Year-9 |
|---|---|---|---|---|---|---|---|---|---|---|
| 1980's | 10,988 | 71,433 | 16,312 | 29,891 | 31,723 | 50,623 | ||||
| 1990's | 34,812 | 15,780 | 17,180 | 11,839 | 12,032 | 16,302 | 21,236 | 17,295 | 9,798 | 10,716 |
| 2000's | 211,751 | 302,599 | 52,221 | 128,322 | 3,417 | 24,161 | 19,308 | 21,329 | 16,112 | 19,495 |
| 2010's | 15,646 | 23,156 | 20,022 | 20,706 | 24,700 | 26,301 | 35,006 | 29,922 | 22,547 | 25,160 |
| 2020's | 13,092 |
| - = No Data Reported; -- = Not Applicable; NA = Not Available; W = Withheld to avoid disclosure of individual company data. |
| Release Date: 2/9/2022 |
| Next Release Date: Suspended |