|
Download Data (XLS File) |
|
|||||
|
|||||
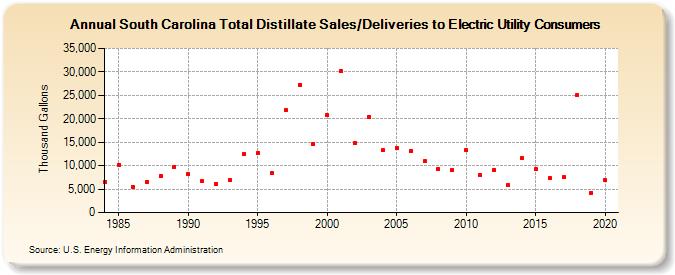
| South Carolina Total Distillate Sales/Deliveries to Electric Utility Consumers (Thousand Gallons) | |||||
| Decade | Year-0 | Year-1 | Year-2 | Year-3 | Year-4 | Year-5 | Year-6 | Year-7 | Year-8 | Year-9 |
|---|---|---|---|---|---|---|---|---|---|---|
| 1980's | 6,601 | 10,231 | 5,547 | 6,477 | 7,824 | 9,773 | ||||
| 1990's | 8,220 | 6,671 | 6,131 | 6,902 | 12,447 | 12,743 | 8,364 | 21,796 | 27,258 | 14,546 |
| 2000's | 20,785 | 30,151 | 14,807 | 20,437 | 13,257 | 13,780 | 13,129 | 10,901 | 9,235 | 9,001 |
| 2010's | 13,245 | 7,984 | 9,153 | 5,848 | 11,587 | 9,200 | 7,322 | 7,547 | 24,965 | 4,256 |
| 2020's | 6,872 |
| - = No Data Reported; -- = Not Applicable; NA = Not Available; W = Withheld to avoid disclosure of individual company data. |
| Release Date: 2/9/2022 |
| Next Release Date: Suspended |