|
Download Data (XLS File) |
|
|||||
|
|||||
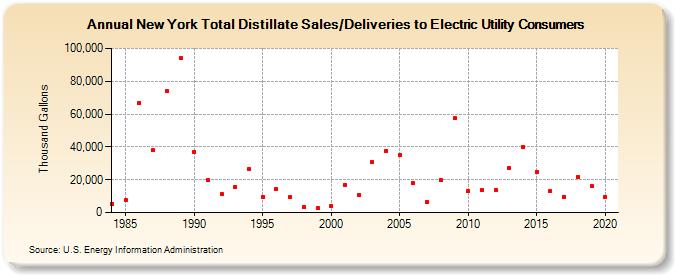
| New York Total Distillate Sales/Deliveries to Electric Utility Consumers (Thousand Gallons) | |||||
| Decade | Year-0 | Year-1 | Year-2 | Year-3 | Year-4 | Year-5 | Year-6 | Year-7 | Year-8 | Year-9 |
|---|---|---|---|---|---|---|---|---|---|---|
| 1980's | 5,276 | 7,623 | 66,938 | 37,883 | 73,790 | 93,882 | ||||
| 1990's | 37,143 | 19,592 | 11,431 | 15,858 | 26,516 | 9,203 | 14,299 | 9,306 | 3,309 | 2,723 |
| 2000's | 3,852 | 16,864 | 10,697 | 31,030 | 37,736 | 34,835 | 17,834 | 6,302 | 19,951 | 57,527 |
| 2010's | 13,021 | 13,855 | 13,674 | 26,841 | 40,103 | 24,716 | 12,930 | 9,722 | 21,865 | 16,246 |
| 2020's | 9,463 |
| - = No Data Reported; -- = Not Applicable; NA = Not Available; W = Withheld to avoid disclosure of individual company data. |
| Release Date: 2/9/2022 |
| Next Release Date: Suspended |