|
Download Data (XLS File) |
|
|||||
|
|||||
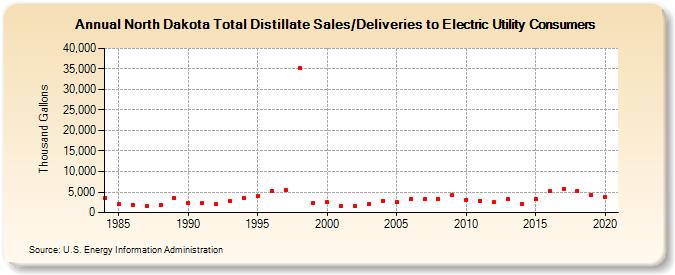
| North Dakota Total Distillate Sales/Deliveries to Electric Utility Consumers (Thousand Gallons) | |||||
| Decade | Year-0 | Year-1 | Year-2 | Year-3 | Year-4 | Year-5 | Year-6 | Year-7 | Year-8 | Year-9 |
|---|---|---|---|---|---|---|---|---|---|---|
| 1980's | 3,610 | 1,969 | 1,952 | 1,491 | 1,799 | 3,540 | ||||
| 1990's | 2,284 | 2,244 | 2,046 | 2,799 | 3,462 | 3,945 | 5,293 | 5,441 | 35,210 | 2,437 |
| 2000's | 2,472 | 1,586 | 1,620 | 2,017 | 2,817 | 2,570 | 3,245 | 3,230 | 3,293 | 4,333 |
| 2010's | 3,023 | 2,892 | 2,481 | 3,206 | 2,130 | 3,310 | 5,160 | 5,804 | 5,325 | 4,280 |
| 2020's | 3,796 |
| - = No Data Reported; -- = Not Applicable; NA = Not Available; W = Withheld to avoid disclosure of individual company data. |
| Release Date: 2/9/2022 |
| Next Release Date: Suspended |