|
Download Data (XLS File) |
|
|||||
|
|||||
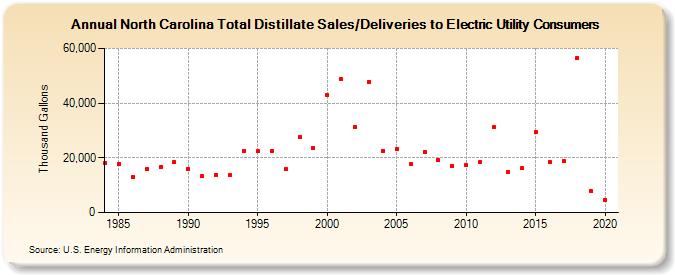
| North Carolina Total Distillate Sales/Deliveries to Electric Utility Consumers (Thousand Gallons) | |||||
| Decade | Year-0 | Year-1 | Year-2 | Year-3 | Year-4 | Year-5 | Year-6 | Year-7 | Year-8 | Year-9 |
|---|---|---|---|---|---|---|---|---|---|---|
| 1980's | 18,010 | 17,746 | 13,129 | 15,779 | 16,592 | 18,444 | ||||
| 1990's | 15,847 | 13,191 | 13,776 | 13,705 | 22,674 | 22,352 | 22,454 | 15,943 | 27,539 | 23,587 |
| 2000's | 43,122 | 48,642 | 31,432 | 47,884 | 22,681 | 23,272 | 17,626 | 22,223 | 19,263 | 16,967 |
| 2010's | 17,268 | 18,560 | 31,173 | 14,707 | 16,120 | 29,313 | 18,462 | 18,812 | 56,423 | 7,698 |
| 2020's | 4,683 |
| - = No Data Reported; -- = Not Applicable; NA = Not Available; W = Withheld to avoid disclosure of individual company data. |
| Release Date: 2/9/2022 |
| Next Release Date: Suspended |