|
Download Data (XLS File) |
|
|||||
|
|||||
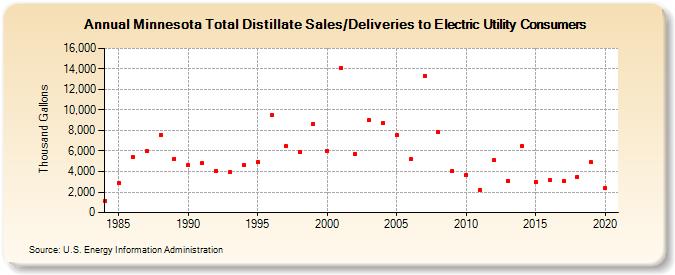
| Minnesota Total Distillate Sales/Deliveries to Electric Utility Consumers (Thousand Gallons) | |||||
| Decade | Year-0 | Year-1 | Year-2 | Year-3 | Year-4 | Year-5 | Year-6 | Year-7 | Year-8 | Year-9 |
|---|---|---|---|---|---|---|---|---|---|---|
| 1980's | 1,156 | 2,897 | 5,402 | 5,957 | 7,596 | 5,252 | ||||
| 1990's | 4,607 | 4,800 | 4,091 | 3,922 | 4,607 | 4,906 | 9,470 | 6,454 | 5,905 | 8,651 |
| 2000's | 6,020 | 14,084 | 5,730 | 8,990 | 8,727 | 7,575 | 5,184 | 13,338 | 7,846 | 4,028 |
| 2010's | 3,691 | 2,205 | 5,107 | 3,116 | 6,443 | 2,979 | 3,132 | 3,032 | 3,495 | 4,895 |
| 2020's | 2,393 |
| - = No Data Reported; -- = Not Applicable; NA = Not Available; W = Withheld to avoid disclosure of individual company data. |
| Release Date: 2/9/2022 |
| Next Release Date: Suspended |