|
Download Data (XLS File) |
|
|||||
|
|||||
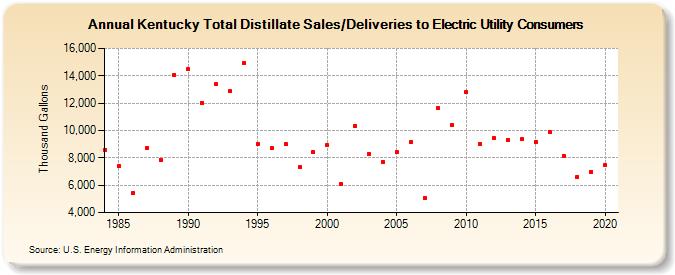
| Kentucky Total Distillate Sales/Deliveries to Electric Utility Consumers (Thousand Gallons) | |||||
| Decade | Year-0 | Year-1 | Year-2 | Year-3 | Year-4 | Year-5 | Year-6 | Year-7 | Year-8 | Year-9 |
|---|---|---|---|---|---|---|---|---|---|---|
| 1980's | 8,599 | 7,420 | 5,412 | 8,738 | 7,866 | 14,074 | ||||
| 1990's | 14,475 | 12,040 | 13,363 | 12,854 | 14,943 | 9,035 | 8,708 | 9,007 | 7,311 | 8,405 |
| 2000's | 8,935 | 6,059 | 10,319 | 8,308 | 7,698 | 8,391 | 9,137 | 5,066 | 11,608 | 10,409 |
| 2010's | 12,814 | 9,037 | 9,441 | 9,290 | 9,369 | 9,187 | 9,911 | 8,161 | 6,610 | 6,979 |
| 2020's | 7,454 |
| - = No Data Reported; -- = Not Applicable; NA = Not Available; W = Withheld to avoid disclosure of individual company data. |
| Release Date: 2/9/2022 |
| Next Release Date: Suspended |