|
Download Data (XLS File) |
|
|||||
|
|||||
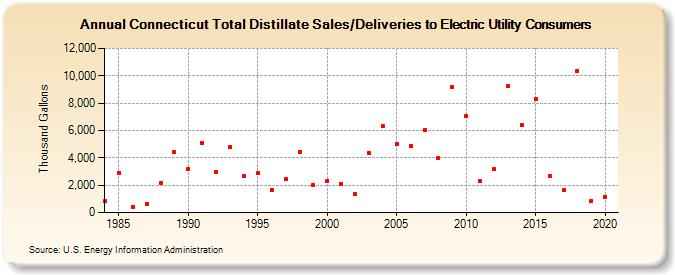
| Connecticut Total Distillate Sales/Deliveries to Electric Utility Consumers (Thousand Gallons) | |||||
| Decade | Year-0 | Year-1 | Year-2 | Year-3 | Year-4 | Year-5 | Year-6 | Year-7 | Year-8 | Year-9 |
|---|---|---|---|---|---|---|---|---|---|---|
| 1980's | 844 | 2,918 | 421 | 636 | 2,165 | 4,431 | ||||
| 1990's | 3,202 | 5,120 | 2,965 | 4,782 | 2,671 | 2,858 | 1,663 | 2,429 | 4,451 | 2,050 |
| 2000's | 2,320 | 2,105 | 1,367 | 4,379 | 6,306 | 5,042 | 4,853 | 6,032 | 3,958 | 9,173 |
| 2010's | 7,082 | 2,279 | 3,165 | 9,254 | 6,381 | 8,313 | 2,692 | 1,621 | 10,332 | 845 |
| 2020's | 1,121 |
| - = No Data Reported; -- = Not Applicable; NA = Not Available; W = Withheld to avoid disclosure of individual company data. |
| Release Date: 2/9/2022 |
| Next Release Date: Suspended |