|
Download Data (XLS File) |
|
|||||
|
|||||
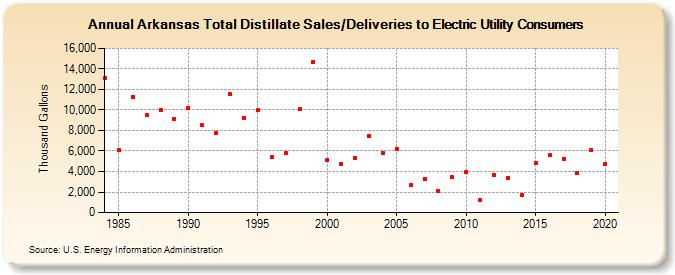
| Arkansas Total Distillate Sales/Deliveries to Electric Utility Consumers (Thousand Gallons) | |||||
| Decade | Year-0 | Year-1 | Year-2 | Year-3 | Year-4 | Year-5 | Year-6 | Year-7 | Year-8 | Year-9 |
|---|---|---|---|---|---|---|---|---|---|---|
| 1980's | 13,115 | 6,092 | 11,291 | 9,533 | 9,993 | 9,110 | ||||
| 1990's | 10,230 | 8,495 | 7,774 | 11,518 | 9,235 | 9,954 | 5,412 | 5,788 | 10,106 | 14,709 |
| 2000's | 5,153 | 4,754 | 5,344 | 7,490 | 5,765 | 6,193 | 2,675 | 3,286 | 2,081 | 3,459 |
| 2010's | 3,919 | 1,184 | 3,684 | 3,353 | 1,694 | 4,860 | 5,576 | 5,209 | 3,848 | 6,119 |
| 2020's | 4,757 |
| - = No Data Reported; -- = Not Applicable; NA = Not Available; W = Withheld to avoid disclosure of individual company data. |
| Release Date: 2/9/2022 |
| Next Release Date: Suspended |