|
Download Data (XLS File) |
|
|||||
|
|||||
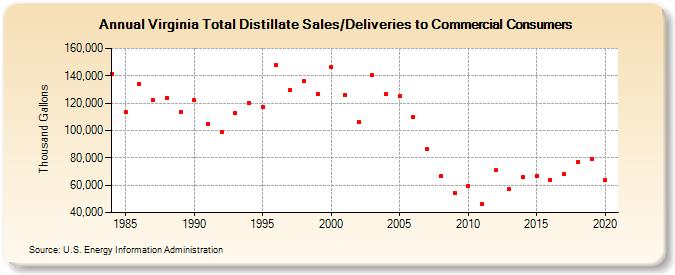
| Virginia Total Distillate Sales/Deliveries to Commercial Consumers (Thousand Gallons) | |||||
| Decade | Year-0 | Year-1 | Year-2 | Year-3 | Year-4 | Year-5 | Year-6 | Year-7 | Year-8 | Year-9 |
|---|---|---|---|---|---|---|---|---|---|---|
| 1980's | 141,441 | 113,206 | 133,886 | 122,446 | 124,082 | 113,531 | ||||
| 1990's | 122,014 | 104,709 | 98,540 | 112,608 | 120,308 | 117,323 | 147,697 | 129,373 | 136,032 | 127,025 |
| 2000's | 146,066 | 126,065 | 106,131 | 140,496 | 126,833 | 125,069 | 109,758 | 86,146 | 66,488 | 54,320 |
| 2010's | 59,664 | 46,216 | 71,076 | 57,214 | 65,815 | 66,777 | 63,890 | 67,903 | 76,741 | 79,019 |
| 2020's | 63,784 |
| - = No Data Reported; -- = Not Applicable; NA = Not Available; W = Withheld to avoid disclosure of individual company data. |
| Release Date: 2/9/2022 |
| Next Release Date: Suspended |