|
Download Data (XLS File) |
|
|||||
|
|||||
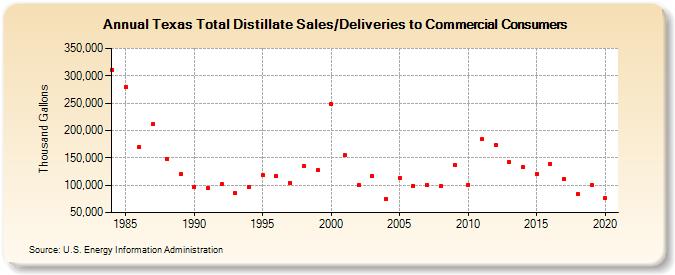
| Texas Total Distillate Sales/Deliveries to Commercial Consumers (Thousand Gallons) | |||||
| Decade | Year-0 | Year-1 | Year-2 | Year-3 | Year-4 | Year-5 | Year-6 | Year-7 | Year-8 | Year-9 |
|---|---|---|---|---|---|---|---|---|---|---|
| 1980's | 310,906 | 279,300 | 170,207 | 211,289 | 147,850 | 119,634 | ||||
| 1990's | 96,408 | 94,299 | 101,406 | 85,284 | 97,197 | 117,890 | 116,474 | 104,880 | 134,923 | 127,317 |
| 2000's | 248,770 | 154,514 | 100,044 | 117,133 | 75,273 | 114,032 | 98,664 | 100,706 | 97,965 | 136,419 |
| 2010's | 100,886 | 184,312 | 173,303 | 142,268 | 132,601 | 120,586 | 139,524 | 111,619 | 83,918 | 100,758 |
| 2020's | 75,766 |
| - = No Data Reported; -- = Not Applicable; NA = Not Available; W = Withheld to avoid disclosure of individual company data. |
| Release Date: 2/9/2022 |
| Next Release Date: Suspended |