|
Download Data (XLS File) |
|
|||||
|
|||||
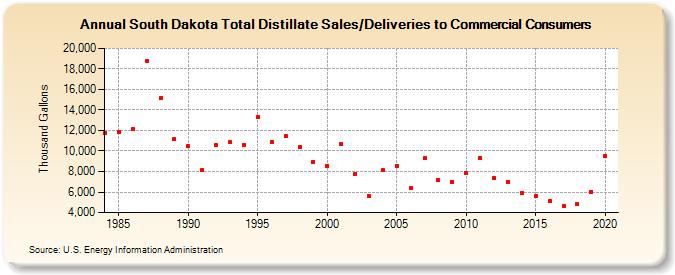
| South Dakota Total Distillate Sales/Deliveries to Commercial Consumers (Thousand Gallons) | |||||
| Decade | Year-0 | Year-1 | Year-2 | Year-3 | Year-4 | Year-5 | Year-6 | Year-7 | Year-8 | Year-9 |
|---|---|---|---|---|---|---|---|---|---|---|
| 1980's | 11,742 | 11,884 | 12,107 | 18,779 | 15,157 | 11,148 | ||||
| 1990's | 10,477 | 8,108 | 10,555 | 10,832 | 10,619 | 13,290 | 10,895 | 11,437 | 10,416 | 8,964 |
| 2000's | 8,568 | 10,703 | 7,757 | 5,661 | 8,118 | 8,550 | 6,442 | 9,285 | 7,145 | 6,991 |
| 2010's | 7,895 | 9,314 | 7,406 | 7,004 | 5,921 | 5,588 | 5,153 | 4,609 | 4,794 | 6,046 |
| 2020's | 9,534 |
| - = No Data Reported; -- = Not Applicable; NA = Not Available; W = Withheld to avoid disclosure of individual company data. |
| Release Date: 2/9/2022 |
| Next Release Date: Suspended |