|
Download Data (XLS File) |
|
|||||
|
|||||
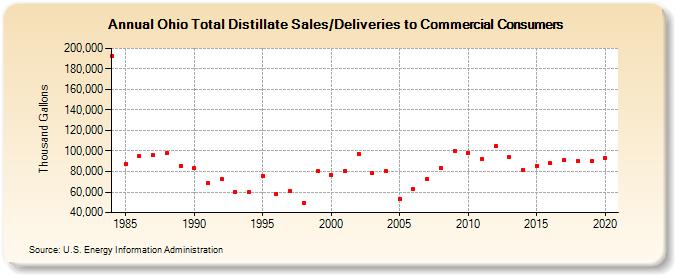
| Ohio Total Distillate Sales/Deliveries to Commercial Consumers (Thousand Gallons) | |||||
| Decade | Year-0 | Year-1 | Year-2 | Year-3 | Year-4 | Year-5 | Year-6 | Year-7 | Year-8 | Year-9 |
|---|---|---|---|---|---|---|---|---|---|---|
| 1980's | 192,668 | 87,100 | 95,022 | 96,037 | 97,982 | 85,349 | ||||
| 1990's | 83,195 | 68,353 | 72,390 | 60,521 | 60,000 | 75,471 | 58,032 | 61,008 | 49,362 | 80,297 |
| 2000's | 76,527 | 80,330 | 97,454 | 78,193 | 80,936 | 53,305 | 62,552 | 72,823 | 83,840 | 100,174 |
| 2010's | 98,451 | 91,961 | 104,662 | 93,824 | 81,554 | 85,513 | 88,079 | 90,779 | 90,034 | 90,272 |
| 2020's | 93,041 |
| - = No Data Reported; -- = Not Applicable; NA = Not Available; W = Withheld to avoid disclosure of individual company data. |
| Release Date: 2/9/2022 |
| Next Release Date: Suspended |