|
Download Data (XLS File) |
|
|||||
|
|||||
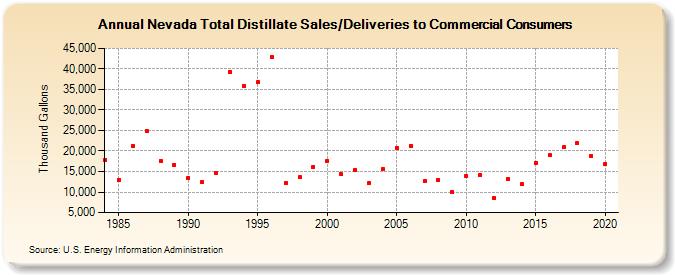
| Nevada Total Distillate Sales/Deliveries to Commercial Consumers (Thousand Gallons) | |||||
| Decade | Year-0 | Year-1 | Year-2 | Year-3 | Year-4 | Year-5 | Year-6 | Year-7 | Year-8 | Year-9 |
|---|---|---|---|---|---|---|---|---|---|---|
| 1980's | 17,881 | 12,983 | 21,217 | 24,954 | 17,653 | 16,634 | ||||
| 1990's | 13,490 | 12,399 | 14,707 | 39,343 | 35,838 | 36,723 | 42,911 | 12,261 | 13,550 | 16,163 |
| 2000's | 17,634 | 14,293 | 15,440 | 12,137 | 15,592 | 20,720 | 21,232 | 12,607 | 12,936 | 10,008 |
| 2010's | 13,945 | 14,195 | 8,531 | 13,290 | 11,909 | 17,153 | 18,938 | 20,865 | 21,851 | 18,766 |
| 2020's | 16,872 |
| - = No Data Reported; -- = Not Applicable; NA = Not Available; W = Withheld to avoid disclosure of individual company data. |
| Release Date: 2/9/2022 |
| Next Release Date: Suspended |