|
Download Data (XLS File) |
|
|||||
|
|||||
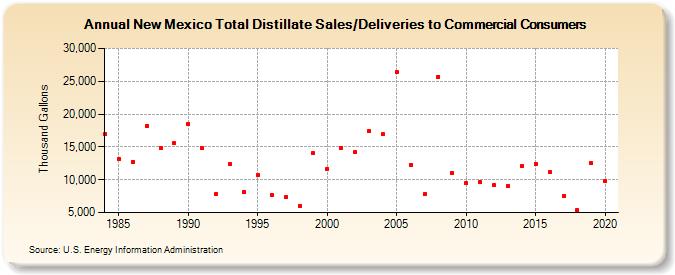
| New Mexico Total Distillate Sales/Deliveries to Commercial Consumers (Thousand Gallons) | |||||
| Decade | Year-0 | Year-1 | Year-2 | Year-3 | Year-4 | Year-5 | Year-6 | Year-7 | Year-8 | Year-9 |
|---|---|---|---|---|---|---|---|---|---|---|
| 1980's | 16,900 | 13,172 | 12,760 | 18,249 | 14,859 | 15,544 | ||||
| 1990's | 18,459 | 14,772 | 7,861 | 12,355 | 8,155 | 10,691 | 7,639 | 7,347 | 6,071 | 14,006 |
| 2000's | 11,676 | 14,906 | 14,199 | 17,355 | 16,892 | 26,371 | 12,288 | 7,798 | 25,700 | 11,030 |
| 2010's | 9,435 | 9,609 | 9,145 | 9,112 | 12,114 | 12,428 | 11,127 | 7,526 | 5,342 | 12,503 |
| 2020's | 9,746 |
| - = No Data Reported; -- = Not Applicable; NA = Not Available; W = Withheld to avoid disclosure of individual company data. |
| Release Date: 2/9/2022 |
| Next Release Date: Suspended |