|
Download Data (XLS File) |
|
|||||
|
|||||
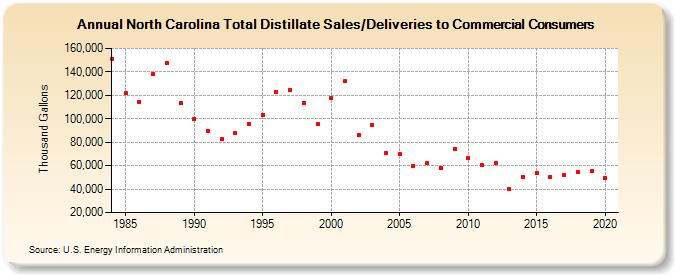
| North Carolina Total Distillate Sales/Deliveries to Commercial Consumers (Thousand Gallons) | |||||
| Decade | Year-0 | Year-1 | Year-2 | Year-3 | Year-4 | Year-5 | Year-6 | Year-7 | Year-8 | Year-9 |
|---|---|---|---|---|---|---|---|---|---|---|
| 1980's | 151,332 | 121,904 | 114,436 | 138,175 | 147,362 | 113,509 | ||||
| 1990's | 99,784 | 89,432 | 82,645 | 87,694 | 95,644 | 103,565 | 122,749 | 124,485 | 113,495 | 95,865 |
| 2000's | 117,796 | 131,882 | 86,037 | 94,803 | 70,391 | 70,053 | 59,991 | 61,936 | 58,330 | 73,858 |
| 2010's | 66,170 | 60,967 | 61,940 | 39,772 | 50,551 | 53,446 | 50,568 | 52,196 | 54,255 | 55,050 |
| 2020's | 49,438 |
| - = No Data Reported; -- = Not Applicable; NA = Not Available; W = Withheld to avoid disclosure of individual company data. |
| Release Date: 2/9/2022 |
| Next Release Date: Suspended |