|
Download Data (XLS File) |
|
|||||
|
|||||
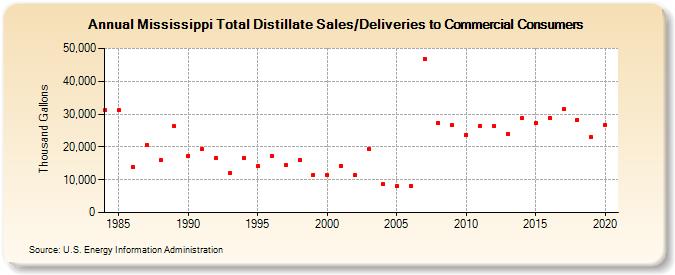
| Mississippi Total Distillate Sales/Deliveries to Commercial Consumers (Thousand Gallons) | |||||
| Decade | Year-0 | Year-1 | Year-2 | Year-3 | Year-4 | Year-5 | Year-6 | Year-7 | Year-8 | Year-9 |
|---|---|---|---|---|---|---|---|---|---|---|
| 1980's | 31,118 | 31,097 | 13,894 | 20,528 | 15,869 | 26,273 | ||||
| 1990's | 17,336 | 19,417 | 16,683 | 11,980 | 16,644 | 14,039 | 17,268 | 14,354 | 16,054 | 11,522 |
| 2000's | 11,457 | 14,127 | 11,324 | 19,271 | 8,670 | 8,088 | 8,174 | 46,890 | 27,288 | 26,641 |
| 2010's | 23,713 | 26,383 | 26,386 | 24,019 | 28,803 | 27,158 | 28,919 | 31,479 | 28,299 | 22,937 |
| 2020's | 26,778 |
| - = No Data Reported; -- = Not Applicable; NA = Not Available; W = Withheld to avoid disclosure of individual company data. |
| Release Date: 2/9/2022 |
| Next Release Date: Suspended |