|
Download Data (XLS File) |
|
|||||
|
|||||
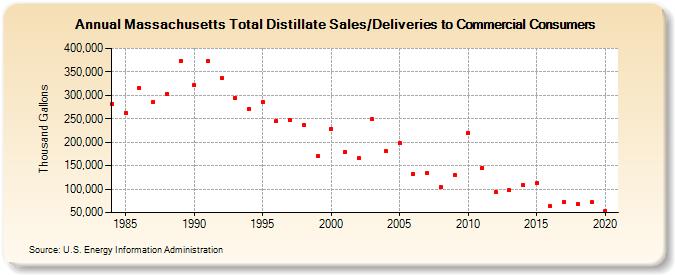
| Massachusetts Total Distillate Sales/Deliveries to Commercial Consumers (Thousand Gallons) | |||||
| Decade | Year-0 | Year-1 | Year-2 | Year-3 | Year-4 | Year-5 | Year-6 | Year-7 | Year-8 | Year-9 |
|---|---|---|---|---|---|---|---|---|---|---|
| 1980's | 280,964 | 262,444 | 315,907 | 285,930 | 303,731 | 374,122 | ||||
| 1990's | 321,109 | 373,687 | 336,992 | 294,489 | 270,920 | 286,118 | 245,020 | 247,024 | 237,347 | 169,885 |
| 2000's | 228,901 | 179,678 | 165,649 | 248,404 | 180,658 | 197,748 | 133,125 | 134,184 | 104,471 | 129,062 |
| 2010's | 219,929 | 143,938 | 94,217 | 97,065 | 108,719 | 112,284 | 62,976 | 73,291 | 67,315 | 71,822 |
| 2020's | 54,214 |
| - = No Data Reported; -- = Not Applicable; NA = Not Available; W = Withheld to avoid disclosure of individual company data. |
| Release Date: 2/9/2022 |
| Next Release Date: Suspended |