|
Download Data (XLS File) |
|
|||||
|
|||||
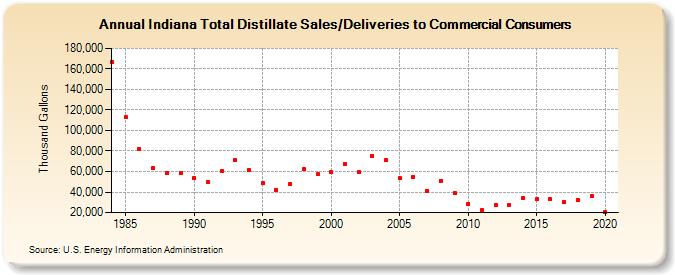
| Indiana Total Distillate Sales/Deliveries to Commercial Consumers (Thousand Gallons) | |||||
| Decade | Year-0 | Year-1 | Year-2 | Year-3 | Year-4 | Year-5 | Year-6 | Year-7 | Year-8 | Year-9 |
|---|---|---|---|---|---|---|---|---|---|---|
| 1980's | 166,680 | 112,829 | 82,185 | 63,346 | 58,741 | 58,438 | ||||
| 1990's | 53,910 | 49,773 | 60,883 | 70,824 | 61,393 | 48,748 | 41,931 | 47,620 | 62,472 | 57,163 |
| 2000's | 59,084 | 67,134 | 59,558 | 75,012 | 70,834 | 53,476 | 54,678 | 41,092 | 51,004 | 39,097 |
| 2010's | 28,687 | 22,195 | 27,706 | 27,524 | 34,235 | 32,796 | 32,965 | 30,633 | 32,541 | 36,354 |
| 2020's | 20,847 |
| - = No Data Reported; -- = Not Applicable; NA = Not Available; W = Withheld to avoid disclosure of individual company data. |
| Release Date: 2/9/2022 |
| Next Release Date: Suspended |