|
Download Data (XLS File) |
|
|||||
|
|||||
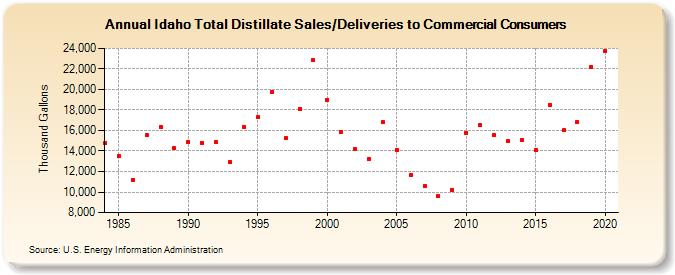
| Idaho Total Distillate Sales/Deliveries to Commercial Consumers (Thousand Gallons) | |||||
| Decade | Year-0 | Year-1 | Year-2 | Year-3 | Year-4 | Year-5 | Year-6 | Year-7 | Year-8 | Year-9 |
|---|---|---|---|---|---|---|---|---|---|---|
| 1980's | 14,757 | 13,507 | 11,210 | 15,528 | 16,359 | 14,257 | ||||
| 1990's | 14,911 | 14,828 | 14,854 | 12,966 | 16,331 | 17,305 | 19,758 | 15,275 | 18,097 | 22,833 |
| 2000's | 18,999 | 15,831 | 14,188 | 13,240 | 16,790 | 14,099 | 11,650 | 10,609 | 9,611 | 10,201 |
| 2010's | 15,791 | 16,530 | 15,569 | 14,963 | 15,114 | 14,098 | 18,513 | 16,001 | 16,812 | 22,171 |
| 2020's | 23,785 |
| - = No Data Reported; -- = Not Applicable; NA = Not Available; W = Withheld to avoid disclosure of individual company data. |
| Release Date: 2/9/2022 |
| Next Release Date: Suspended |