|
Download Data (XLS File) |
|
|||||
|
|||||
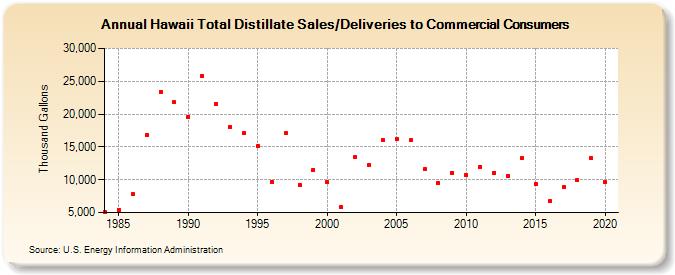
| Hawaii Total Distillate Sales/Deliveries to Commercial Consumers (Thousand Gallons) | |||||
| Decade | Year-0 | Year-1 | Year-2 | Year-3 | Year-4 | Year-5 | Year-6 | Year-7 | Year-8 | Year-9 |
|---|---|---|---|---|---|---|---|---|---|---|
| 1980's | 5,075 | 5,436 | 7,781 | 16,881 | 23,428 | 21,766 | ||||
| 1990's | 19,611 | 25,867 | 21,594 | 18,063 | 17,084 | 15,162 | 9,723 | 17,062 | 9,247 | 11,525 |
| 2000's | 9,604 | 5,807 | 13,397 | 12,228 | 15,985 | 16,137 | 15,976 | 11,619 | 9,483 | 11,098 |
| 2010's | 10,699 | 12,000 | 11,079 | 10,608 | 13,310 | 9,393 | 6,714 | 8,913 | 9,963 | 13,307 |
| 2020's | 9,600 |
| - = No Data Reported; -- = Not Applicable; NA = Not Available; W = Withheld to avoid disclosure of individual company data. |
| Release Date: 2/9/2022 |
| Next Release Date: Suspended |