|
Download Data (XLS File) |
|
|||||
|
|||||
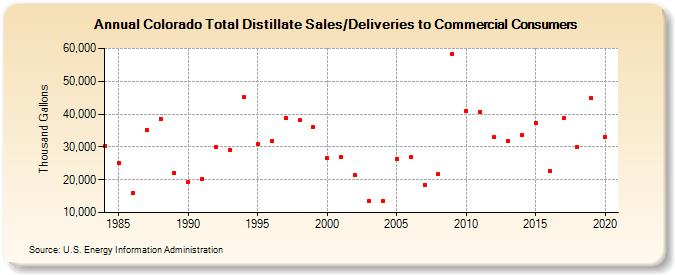
| Colorado Total Distillate Sales/Deliveries to Commercial Consumers (Thousand Gallons) | |||||
| Decade | Year-0 | Year-1 | Year-2 | Year-3 | Year-4 | Year-5 | Year-6 | Year-7 | Year-8 | Year-9 |
|---|---|---|---|---|---|---|---|---|---|---|
| 1980's | 30,357 | 25,124 | 15,950 | 35,230 | 38,625 | 22,055 | ||||
| 1990's | 19,163 | 20,191 | 29,892 | 29,060 | 45,119 | 31,030 | 31,834 | 38,813 | 38,098 | 36,021 |
| 2000's | 26,607 | 26,943 | 21,465 | 13,524 | 13,538 | 26,235 | 26,823 | 18,436 | 21,650 | 58,311 |
| 2010's | 40,783 | 40,645 | 33,019 | 31,644 | 33,757 | 37,299 | 22,744 | 38,658 | 30,086 | 44,889 |
| 2020's | 33,138 |
| - = No Data Reported; -- = Not Applicable; NA = Not Available; W = Withheld to avoid disclosure of individual company data. |
| Release Date: 2/9/2022 |
| Next Release Date: Suspended |