|
Download Data (XLS File) |
|
|||||
|
|||||
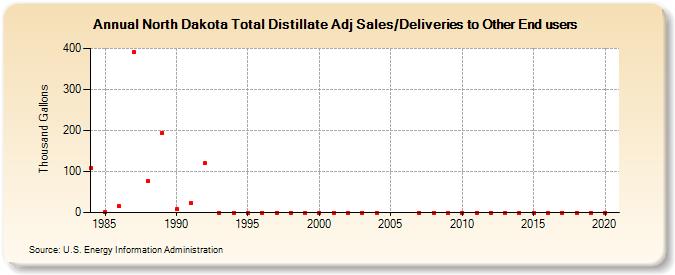
| North Dakota Total Distillate Adj Sales/Deliveries to Other End users (Thousand Gallons) | |||||
| Decade | Year-0 | Year-1 | Year-2 | Year-3 | Year-4 | Year-5 | Year-6 | Year-7 | Year-8 | Year-9 |
|---|---|---|---|---|---|---|---|---|---|---|
| 1980's | 109 | 1 | 15 | 390 | 76 | 194 | ||||
| 1990's | 8 | 24 | 120 | 0 | 0 | 0 | 0 | 0 | 0 | 0 |
| 2000's | 0 | 0 | 0 | 0 | 0 | -- | -- | 0 | 0 | 0 |
| 2010's | 0 | 0 | 0 | 0 | 0 | 0 | 0 | 0 | 0 | 0 |
| 2020's | 0 |
| - = No Data Reported; -- = Not Applicable; NA = Not Available; W = Withheld to avoid disclosure of individual company data. |
| Release Date: 2/9/2022 |
| Next Release Date: Suspended |