|
Download Data (XLS File) |
|
|||||
|
|||||
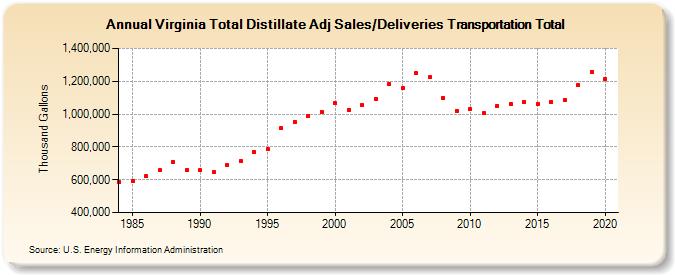
| Virginia Total Distillate Adj Sales/Deliveries Transportation Total (Thousand Gallons) | |||||
| Decade | Year-0 | Year-1 | Year-2 | Year-3 | Year-4 | Year-5 | Year-6 | Year-7 | Year-8 | Year-9 |
|---|---|---|---|---|---|---|---|---|---|---|
| 1980's | 584,996 | 589,305 | 620,081 | 657,127 | 708,856 | 657,266 | ||||
| 1990's | 656,523 | 644,972 | 689,617 | 715,121 | 771,456 | 784,697 | 912,508 | 953,555 | 990,520 | 1,014,240 |
| 2000's | 1,064,704 | 1,025,894 | 1,054,298 | 1,092,161 | 1,182,138 | 1,156,169 | 1,247,564 | 1,223,799 | 1,100,725 | 1,020,781 |
| 2010's | 1,029,935 | 1,004,111 | 1,050,146 | 1,062,618 | 1,076,180 | 1,063,001 | 1,076,132 | 1,084,993 | 1,177,478 | 1,259,144 |
| 2020's | 1,212,266 |
| - = No Data Reported; -- = Not Applicable; NA = Not Available; W = Withheld to avoid disclosure of individual company data. |
| Release Date: 2/9/2022 |
| Next Release Date: Suspended |