|
Download Data (XLS File) |
|
|||||
|
|||||
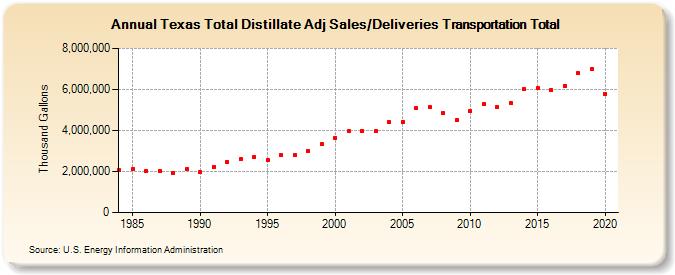
| Texas Total Distillate Adj Sales/Deliveries Transportation Total (Thousand Gallons) | |||||
| Decade | Year-0 | Year-1 | Year-2 | Year-3 | Year-4 | Year-5 | Year-6 | Year-7 | Year-8 | Year-9 |
|---|---|---|---|---|---|---|---|---|---|---|
| 1980's | 2,078,800 | 2,115,109 | 2,041,406 | 2,016,492 | 1,943,963 | 2,098,744 | ||||
| 1990's | 1,974,305 | 2,234,144 | 2,478,026 | 2,605,793 | 2,696,391 | 2,558,410 | 2,801,124 | 2,802,979 | 3,009,324 | 3,346,257 |
| 2000's | 3,650,600 | 3,962,098 | 3,973,852 | 3,958,524 | 4,392,150 | 4,431,874 | 5,071,281 | 5,127,121 | 4,852,990 | 4,501,270 |
| 2010's | 4,939,034 | 5,278,834 | 5,137,673 | 5,337,173 | 6,022,191 | 6,047,564 | 5,971,595 | 6,161,182 | 6,777,041 | 6,991,358 |
| 2020's | 5,784,302 |
| - = No Data Reported; -- = Not Applicable; NA = Not Available; W = Withheld to avoid disclosure of individual company data. |
| Release Date: 2/9/2022 |
| Next Release Date: Suspended |