|
Download Data (XLS File) |
|
|||||
|
|||||
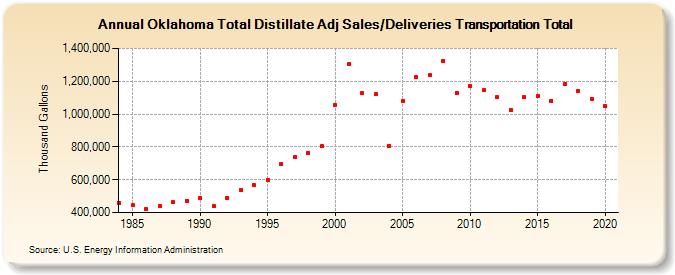
| Oklahoma Total Distillate Adj Sales/Deliveries Transportation Total (Thousand Gallons) | |||||
| Decade | Year-0 | Year-1 | Year-2 | Year-3 | Year-4 | Year-5 | Year-6 | Year-7 | Year-8 | Year-9 |
|---|---|---|---|---|---|---|---|---|---|---|
| 1980's | 455,214 | 444,324 | 419,746 | 440,841 | 461,348 | 472,743 | ||||
| 1990's | 488,300 | 436,946 | 490,435 | 539,456 | 565,332 | 597,570 | 693,613 | 736,637 | 763,309 | 805,292 |
| 2000's | 1,057,428 | 1,302,680 | 1,125,774 | 1,119,232 | 806,616 | 1,077,517 | 1,225,061 | 1,235,903 | 1,325,942 | 1,130,691 |
| 2010's | 1,171,887 | 1,144,502 | 1,102,133 | 1,026,104 | 1,104,148 | 1,108,467 | 1,082,310 | 1,181,657 | 1,142,774 | 1,093,674 |
| 2020's | 1,047,713 |
| - = No Data Reported; -- = Not Applicable; NA = Not Available; W = Withheld to avoid disclosure of individual company data. |
| Release Date: 2/9/2022 |
| Next Release Date: Suspended |