|
Download Data (XLS File) |
|
|||||
|
|||||
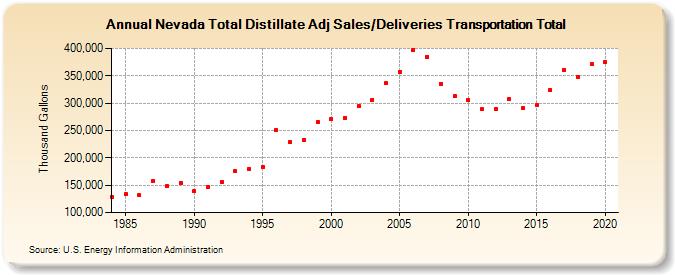
| Nevada Total Distillate Adj Sales/Deliveries Transportation Total (Thousand Gallons) | |||||
| Decade | Year-0 | Year-1 | Year-2 | Year-3 | Year-4 | Year-5 | Year-6 | Year-7 | Year-8 | Year-9 |
|---|---|---|---|---|---|---|---|---|---|---|
| 1980's | 128,960 | 133,168 | 131,381 | 157,453 | 147,877 | 154,566 | ||||
| 1990's | 138,777 | 146,122 | 155,996 | 175,684 | 180,264 | 183,464 | 250,061 | 228,626 | 233,252 | 265,542 |
| 2000's | 270,076 | 273,434 | 294,136 | 306,419 | 335,965 | 357,523 | 397,878 | 384,906 | 335,622 | 312,175 |
| 2010's | 305,550 | 288,473 | 289,923 | 307,760 | 290,591 | 297,264 | 324,091 | 360,326 | 348,193 | 370,927 |
| 2020's | 374,489 |
| - = No Data Reported; -- = Not Applicable; NA = Not Available; W = Withheld to avoid disclosure of individual company data. |
| Release Date: 2/9/2022 |
| Next Release Date: Suspended |