|
Download Data (XLS File) |
|
|||||
|
|||||
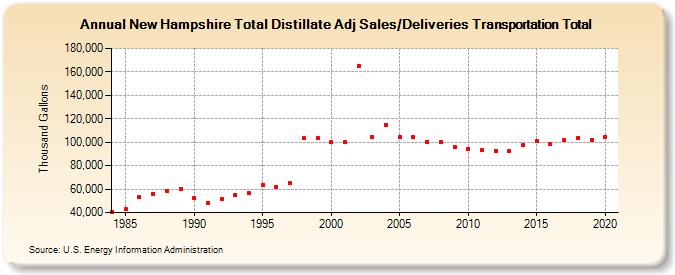
| New Hampshire Total Distillate Adj Sales/Deliveries Transportation Total (Thousand Gallons) | |||||
| Decade | Year-0 | Year-1 | Year-2 | Year-3 | Year-4 | Year-5 | Year-6 | Year-7 | Year-8 | Year-9 |
|---|---|---|---|---|---|---|---|---|---|---|
| 1980's | 40,703 | 42,789 | 53,059 | 56,208 | 58,711 | 59,934 | ||||
| 1990's | 52,605 | 48,561 | 51,577 | 54,870 | 56,345 | 63,700 | 61,836 | 64,993 | 103,764 | 103,835 |
| 2000's | 99,814 | 100,041 | 165,051 | 104,639 | 114,997 | 104,813 | 104,285 | 100,459 | 100,113 | 96,076 |
| 2010's | 94,551 | 93,324 | 92,909 | 92,873 | 97,581 | 100,696 | 98,384 | 101,555 | 103,804 | 101,750 |
| 2020's | 104,546 |
| - = No Data Reported; -- = Not Applicable; NA = Not Available; W = Withheld to avoid disclosure of individual company data. |
| Release Date: 2/9/2022 |
| Next Release Date: Suspended |