|
Download Data (XLS File) |
|
|||||
|
|||||
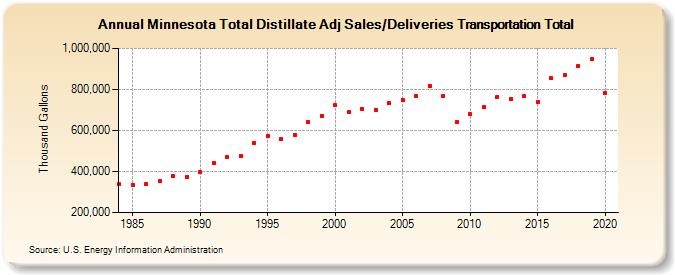
| Minnesota Total Distillate Adj Sales/Deliveries Transportation Total (Thousand Gallons) | |||||
| Decade | Year-0 | Year-1 | Year-2 | Year-3 | Year-4 | Year-5 | Year-6 | Year-7 | Year-8 | Year-9 |
|---|---|---|---|---|---|---|---|---|---|---|
| 1980's | 337,323 | 335,460 | 338,859 | 355,513 | 375,830 | 373,743 | ||||
| 1990's | 397,184 | 440,130 | 469,324 | 476,079 | 540,343 | 573,966 | 558,556 | 579,775 | 641,139 | 671,653 |
| 2000's | 722,903 | 687,822 | 705,503 | 699,813 | 734,903 | 750,089 | 768,439 | 817,786 | 767,218 | 640,572 |
| 2010's | 678,530 | 713,572 | 763,224 | 753,235 | 766,250 | 740,606 | 854,908 | 868,206 | 914,524 | 945,973 |
| 2020's | 784,453 |
| - = No Data Reported; -- = Not Applicable; NA = Not Available; W = Withheld to avoid disclosure of individual company data. |
| Release Date: 2/9/2022 |
| Next Release Date: Suspended |