|
Download Data (XLS File) |
|
|||||
|
|||||
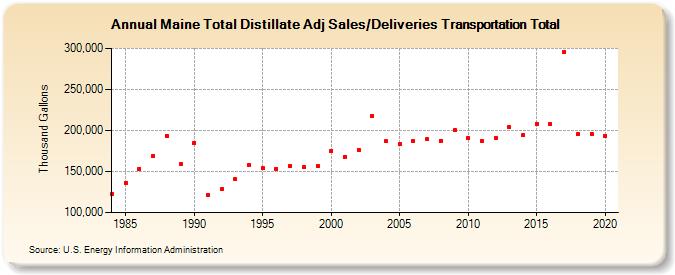
| Maine Total Distillate Adj Sales/Deliveries Transportation Total (Thousand Gallons) | |||||
| Decade | Year-0 | Year-1 | Year-2 | Year-3 | Year-4 | Year-5 | Year-6 | Year-7 | Year-8 | Year-9 |
|---|---|---|---|---|---|---|---|---|---|---|
| 1980's | 122,895 | 136,619 | 153,590 | 168,802 | 193,769 | 158,595 | ||||
| 1990's | 185,081 | 120,844 | 128,595 | 140,314 | 157,517 | 154,110 | 153,556 | 157,236 | 155,327 | 157,002 |
| 2000's | 175,527 | 168,041 | 176,573 | 218,204 | 186,679 | 183,680 | 186,988 | 189,157 | 187,517 | 200,148 |
| 2010's | 190,993 | 187,381 | 191,379 | 203,726 | 194,118 | 208,297 | 207,792 | 295,547 | 195,564 | 195,796 |
| 2020's | 193,632 |
| - = No Data Reported; -- = Not Applicable; NA = Not Available; W = Withheld to avoid disclosure of individual company data. |
| Release Date: 2/9/2022 |
| Next Release Date: Suspended |