|
Download Data (XLS File) |
|
|||||
|
|||||
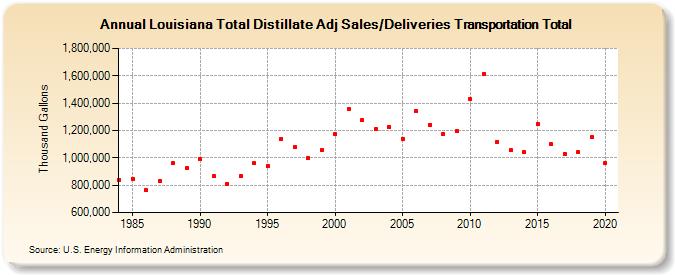
| Louisiana Total Distillate Adj Sales/Deliveries Transportation Total (Thousand Gallons) | |||||
| Decade | Year-0 | Year-1 | Year-2 | Year-3 | Year-4 | Year-5 | Year-6 | Year-7 | Year-8 | Year-9 |
|---|---|---|---|---|---|---|---|---|---|---|
| 1980's | 839,813 | 848,173 | 762,248 | 830,645 | 961,381 | 924,623 | ||||
| 1990's | 989,617 | 863,815 | 809,698 | 866,276 | 960,330 | 943,410 | 1,141,149 | 1,079,370 | 997,112 | 1,058,377 |
| 2000's | 1,172,276 | 1,358,394 | 1,274,839 | 1,207,699 | 1,225,978 | 1,141,024 | 1,341,086 | 1,242,459 | 1,170,749 | 1,193,805 |
| 2010's | 1,430,519 | 1,613,470 | 1,118,540 | 1,054,192 | 1,040,566 | 1,248,787 | 1,098,129 | 1,031,149 | 1,040,752 | 1,151,812 |
| 2020's | 959,818 |
| - = No Data Reported; -- = Not Applicable; NA = Not Available; W = Withheld to avoid disclosure of individual company data. |
| Release Date: 2/9/2022 |
| Next Release Date: Suspended |