|
Download Data (XLS File) |
|
|||||
|
|||||
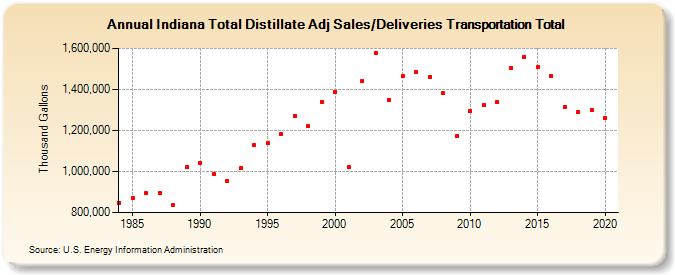
| Indiana Total Distillate Adj Sales/Deliveries Transportation Total (Thousand Gallons) | |||||
| Decade | Year-0 | Year-1 | Year-2 | Year-3 | Year-4 | Year-5 | Year-6 | Year-7 | Year-8 | Year-9 |
|---|---|---|---|---|---|---|---|---|---|---|
| 1980's | 847,129 | 868,924 | 893,691 | 896,373 | 834,487 | 1,020,841 | ||||
| 1990's | 1,041,225 | 986,238 | 954,607 | 1,015,443 | 1,126,932 | 1,137,044 | 1,180,825 | 1,270,294 | 1,220,321 | 1,340,392 |
| 2000's | 1,389,820 | 1,019,763 | 1,441,463 | 1,576,243 | 1,349,547 | 1,463,391 | 1,483,231 | 1,461,680 | 1,382,254 | 1,171,627 |
| 2010's | 1,294,762 | 1,322,225 | 1,336,714 | 1,506,536 | 1,557,079 | 1,511,433 | 1,464,871 | 1,315,672 | 1,287,811 | 1,299,083 |
| 2020's | 1,262,864 |
| - = No Data Reported; -- = Not Applicable; NA = Not Available; W = Withheld to avoid disclosure of individual company data. |
| Release Date: 2/9/2022 |
| Next Release Date: Suspended |