|
Download Data (XLS File) |
|
|||||
|
|||||
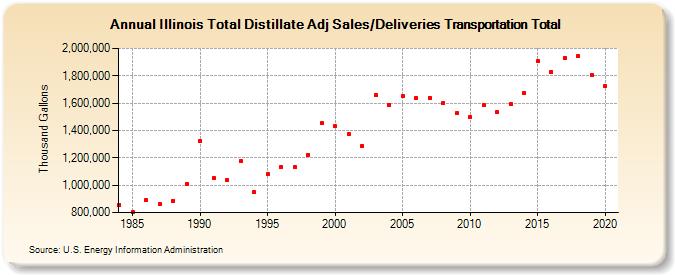
| Illinois Total Distillate Adj Sales/Deliveries Transportation Total (Thousand Gallons) | |||||
| Decade | Year-0 | Year-1 | Year-2 | Year-3 | Year-4 | Year-5 | Year-6 | Year-7 | Year-8 | Year-9 |
|---|---|---|---|---|---|---|---|---|---|---|
| 1980's | 858,706 | 805,053 | 890,632 | 862,173 | 887,919 | 1,012,346 | ||||
| 1990's | 1,325,698 | 1,051,166 | 1,036,594 | 1,176,862 | 949,128 | 1,079,023 | 1,132,407 | 1,130,621 | 1,223,899 | 1,453,689 |
| 2000's | 1,429,137 | 1,370,936 | 1,288,547 | 1,658,401 | 1,588,443 | 1,648,739 | 1,638,358 | 1,639,400 | 1,598,777 | 1,524,401 |
| 2010's | 1,499,123 | 1,584,125 | 1,532,165 | 1,590,876 | 1,675,732 | 1,907,431 | 1,829,452 | 1,933,323 | 1,943,242 | 1,806,378 |
| 2020's | 1,722,233 |
| - = No Data Reported; -- = Not Applicable; NA = Not Available; W = Withheld to avoid disclosure of individual company data. |
| Release Date: 2/9/2022 |
| Next Release Date: Suspended |