|
Download Data (XLS File) |
|
|||||
|
|||||
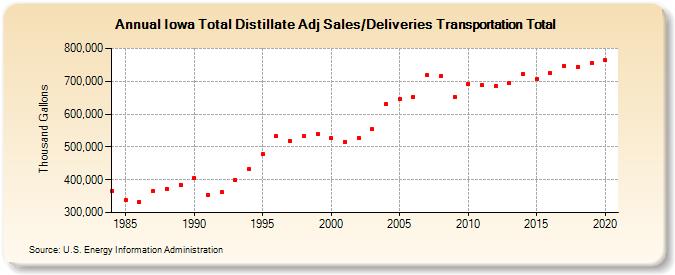
| Iowa Total Distillate Adj Sales/Deliveries Transportation Total (Thousand Gallons) | |||||
| Decade | Year-0 | Year-1 | Year-2 | Year-3 | Year-4 | Year-5 | Year-6 | Year-7 | Year-8 | Year-9 |
|---|---|---|---|---|---|---|---|---|---|---|
| 1980's | 365,555 | 337,787 | 333,337 | 365,637 | 373,014 | 385,388 | ||||
| 1990's | 404,669 | 354,110 | 362,476 | 399,369 | 431,999 | 476,972 | 531,860 | 517,376 | 532,130 | 539,620 |
| 2000's | 527,463 | 515,876 | 527,483 | 553,307 | 630,446 | 644,895 | 652,569 | 718,779 | 714,647 | 652,557 |
| 2010's | 691,317 | 688,521 | 685,458 | 693,784 | 722,379 | 707,501 | 724,941 | 746,057 | 744,240 | 754,364 |
| 2020's | 763,147 |
| - = No Data Reported; -- = Not Applicable; NA = Not Available; W = Withheld to avoid disclosure of individual company data. |
| Release Date: 2/9/2022 |
| Next Release Date: Suspended |