|
Download Data (XLS File) |
|
|||||
|
|||||
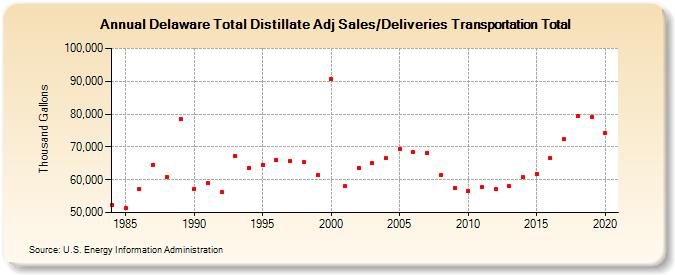
| Delaware Total Distillate Adj Sales/Deliveries Transportation Total (Thousand Gallons) | |||||
| Decade | Year-0 | Year-1 | Year-2 | Year-3 | Year-4 | Year-5 | Year-6 | Year-7 | Year-8 | Year-9 |
|---|---|---|---|---|---|---|---|---|---|---|
| 1980's | 52,341 | 51,420 | 57,144 | 64,559 | 60,829 | 78,386 | ||||
| 1990's | 57,271 | 58,858 | 56,328 | 67,273 | 63,680 | 64,586 | 66,086 | 65,760 | 65,462 | 61,451 |
| 2000's | 90,608 | 57,947 | 63,577 | 65,129 | 66,525 | 69,420 | 68,327 | 68,223 | 61,302 | 57,382 |
| 2010's | 56,676 | 57,720 | 57,229 | 57,982 | 60,743 | 61,888 | 66,608 | 72,337 | 79,423 | 79,045 |
| 2020's | 74,180 |
| - = No Data Reported; -- = Not Applicable; NA = Not Available; W = Withheld to avoid disclosure of individual company data. |
| Release Date: 2/9/2022 |
| Next Release Date: Suspended |