|
Download Data (XLS File) |
|
|||||
|
|||||
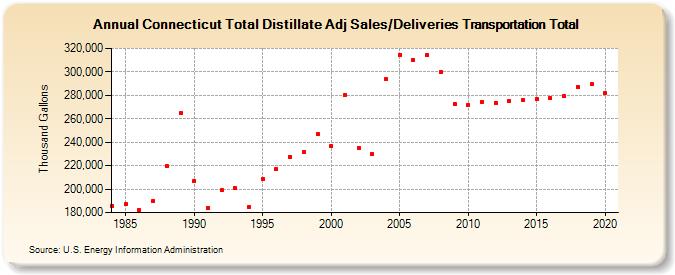
| Connecticut Total Distillate Adj Sales/Deliveries Transportation Total (Thousand Gallons) | |||||
| Decade | Year-0 | Year-1 | Year-2 | Year-3 | Year-4 | Year-5 | Year-6 | Year-7 | Year-8 | Year-9 |
|---|---|---|---|---|---|---|---|---|---|---|
| 1980's | 185,828 | 186,948 | 181,920 | 190,017 | 219,454 | 264,730 | ||||
| 1990's | 207,005 | 184,012 | 199,156 | 200,702 | 185,039 | 208,603 | 216,937 | 227,637 | 231,737 | 246,927 |
| 2000's | 236,873 | 280,179 | 235,251 | 230,146 | 293,776 | 314,642 | 310,348 | 314,309 | 300,255 | 272,598 |
| 2010's | 271,767 | 274,640 | 273,819 | 275,175 | 276,259 | 276,920 | 277,579 | 279,191 | 287,224 | 289,348 |
| 2020's | 281,720 |
| - = No Data Reported; -- = Not Applicable; NA = Not Available; W = Withheld to avoid disclosure of individual company data. |
| Release Date: 2/9/2022 |
| Next Release Date: Suspended |