|
Download Data (XLS File) |
|
|||||
|
|||||
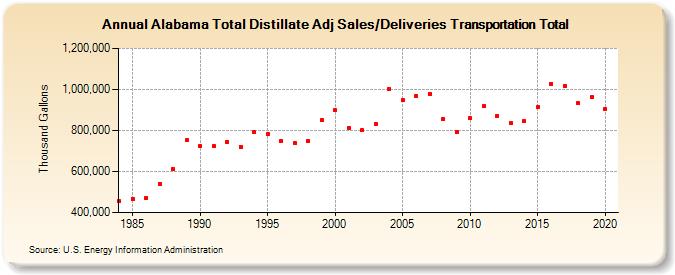
| Alabama Total Distillate Adj Sales/Deliveries Transportation Total (Thousand Gallons) | |||||
| Decade | Year-0 | Year-1 | Year-2 | Year-3 | Year-4 | Year-5 | Year-6 | Year-7 | Year-8 | Year-9 |
|---|---|---|---|---|---|---|---|---|---|---|
| 1980's | 453,947 | 467,731 | 471,614 | 540,803 | 612,245 | 751,828 | ||||
| 1990's | 726,709 | 722,101 | 743,636 | 721,359 | 791,481 | 782,306 | 747,254 | 738,234 | 749,009 | 851,651 |
| 2000's | 897,670 | 814,243 | 800,147 | 832,119 | 1,001,718 | 947,831 | 969,281 | 979,566 | 854,244 | 791,004 |
| 2010's | 859,486 | 917,892 | 871,727 | 836,513 | 845,084 | 913,794 | 1,028,079 | 1,014,466 | 932,118 | 962,073 |
| 2020's | 903,803 |
| - = No Data Reported; -- = Not Applicable; NA = Not Available; W = Withheld to avoid disclosure of individual company data. |
| Release Date: 2/9/2022 |
| Next Release Date: Suspended |