|
Download Data (XLS File) |
|
|||||
|
|||||
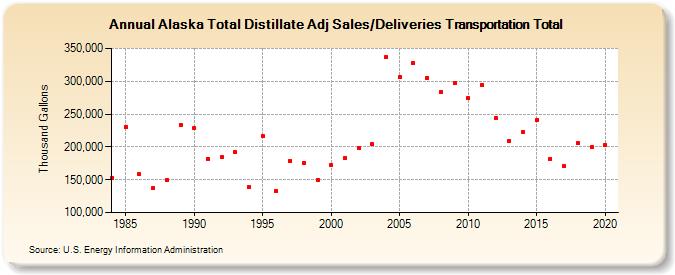
| Alaska Total Distillate Adj Sales/Deliveries Transportation Total (Thousand Gallons) | |||||
| Decade | Year-0 | Year-1 | Year-2 | Year-3 | Year-4 | Year-5 | Year-6 | Year-7 | Year-8 | Year-9 |
|---|---|---|---|---|---|---|---|---|---|---|
| 1980's | 152,628 | 230,380 | 158,038 | 136,676 | 149,617 | 233,497 | ||||
| 1990's | 228,750 | 182,159 | 183,981 | 192,057 | 139,326 | 216,487 | 132,493 | 178,942 | 175,807 | 150,147 |
| 2000's | 172,538 | 183,180 | 197,721 | 203,807 | 336,877 | 306,640 | 327,505 | 304,747 | 283,233 | 297,228 |
| 2010's | 274,247 | 294,782 | 244,001 | 209,098 | 222,057 | 240,564 | 182,052 | 170,508 | 205,863 | 199,293 |
| 2020's | 203,245 |
| - = No Data Reported; -- = Not Applicable; NA = Not Available; W = Withheld to avoid disclosure of individual company data. |
| Release Date: 2/9/2022 |
| Next Release Date: Suspended |