|
Download Data (XLS File) |
|
|||||
|
|||||
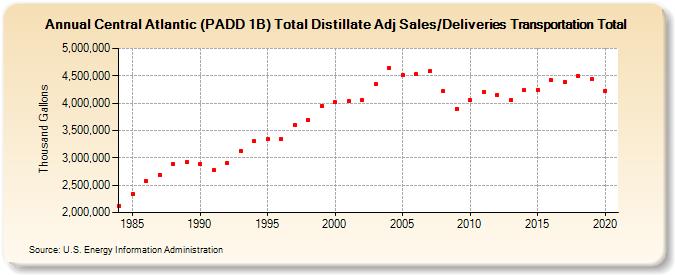
| Central Atlantic (PADD 1B) Total Distillate Adj Sales/Deliveries Transportation Total (Thousand Gallons) | |||||
| Decade | Year-0 | Year-1 | Year-2 | Year-3 | Year-4 | Year-5 | Year-6 | Year-7 | Year-8 | Year-9 |
|---|---|---|---|---|---|---|---|---|---|---|
| 1980's | 2,123,440 | 2,344,624 | 2,576,505 | 2,694,843 | 2,891,109 | 2,918,491 | ||||
| 1990's | 2,886,575 | 2,774,597 | 2,908,328 | 3,125,996 | 3,300,382 | 3,335,107 | 3,345,141 | 3,593,971 | 3,697,039 | 3,952,699 |
| 2000's | 4,011,661 | 4,039,733 | 4,056,310 | 4,343,262 | 4,648,302 | 4,508,155 | 4,523,218 | 4,578,662 | 4,218,256 | 3,900,297 |
| 2010's | 4,055,506 | 4,198,426 | 4,153,198 | 4,061,374 | 4,231,061 | 4,246,212 | 4,418,239 | 4,387,975 | 4,504,352 | 4,439,388 |
| 2020's | 4,229,779 |
| - = No Data Reported; -- = Not Applicable; NA = Not Available; W = Withheld to avoid disclosure of individual company data. |
| Release Date: 2/9/2022 |
| Next Release Date: Suspended |