|
Download Data (XLS File) |
|
|||||
|
|||||
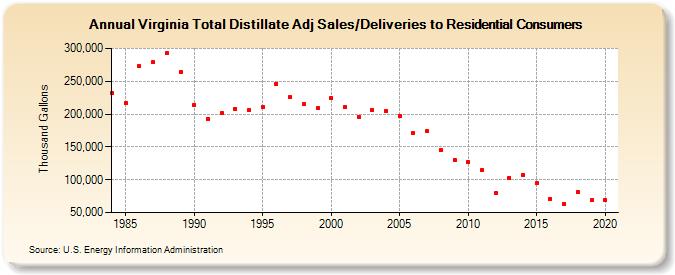
| Virginia Total Distillate Adj Sales/Deliveries to Residential Consumers (Thousand Gallons) | |||||
| Decade | Year-0 | Year-1 | Year-2 | Year-3 | Year-4 | Year-5 | Year-6 | Year-7 | Year-8 | Year-9 |
|---|---|---|---|---|---|---|---|---|---|---|
| 1980's | 232,137 | 216,319 | 272,675 | 278,832 | 292,714 | 263,958 | ||||
| 1990's | 214,004 | 192,841 | 200,882 | 208,103 | 206,078 | 210,110 | 245,942 | 225,927 | 214,843 | 209,061 |
| 2000's | 225,022 | 210,044 | 196,169 | 205,823 | 204,768 | 197,255 | 170,605 | 173,864 | 145,680 | 130,377 |
| 2010's | 127,196 | 115,066 | 79,624 | 102,717 | 107,234 | 94,313 | 70,732 | 62,836 | 81,405 | 68,476 |
| 2020's | 69,067 |
| - = No Data Reported; -- = Not Applicable; NA = Not Available; W = Withheld to avoid disclosure of individual company data. |
| Release Date: 2/9/2022 |
| Next Release Date: Suspended |