|
Download Data (XLS File) |
|
|||||
|
|||||
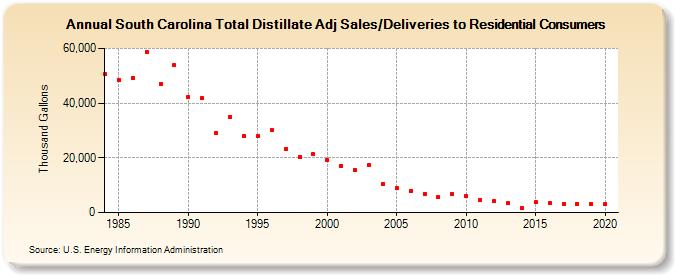
| South Carolina Total Distillate Adj Sales/Deliveries to Residential Consumers (Thousand Gallons) | |||||
| Decade | Year-0 | Year-1 | Year-2 | Year-3 | Year-4 | Year-5 | Year-6 | Year-7 | Year-8 | Year-9 |
|---|---|---|---|---|---|---|---|---|---|---|
| 1980's | 50,517 | 48,525 | 49,350 | 58,813 | 47,027 | 53,820 | ||||
| 1990's | 42,298 | 41,905 | 28,978 | 34,951 | 28,017 | 28,157 | 30,344 | 23,172 | 20,341 | 21,229 |
| 2000's | 19,113 | 16,983 | 15,520 | 17,287 | 10,515 | 8,810 | 7,962 | 6,842 | 5,588 | 6,782 |
| 2010's | 5,884 | 4,513 | 4,109 | 3,361 | 1,824 | 3,729 | 3,500 | 3,259 | 3,135 | 3,077 |
| 2020's | 3,089 |
| - = No Data Reported; -- = Not Applicable; NA = Not Available; W = Withheld to avoid disclosure of individual company data. |
| Release Date: 2/9/2022 |
| Next Release Date: Suspended |