|
Download Data (XLS File) |
|
|||||
|
|||||
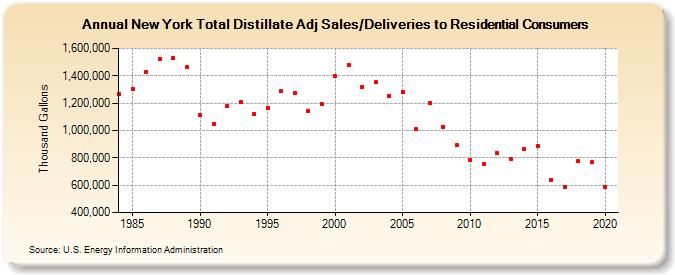
| New York Total Distillate Adj Sales/Deliveries to Residential Consumers (Thousand Gallons) | |||||
| Decade | Year-0 | Year-1 | Year-2 | Year-3 | Year-4 | Year-5 | Year-6 | Year-7 | Year-8 | Year-9 |
|---|---|---|---|---|---|---|---|---|---|---|
| 1980's | 1,265,010 | 1,304,675 | 1,430,302 | 1,521,225 | 1,529,357 | 1,460,843 | ||||
| 1990's | 1,111,493 | 1,050,560 | 1,176,304 | 1,204,815 | 1,122,298 | 1,165,204 | 1,288,927 | 1,272,482 | 1,139,875 | 1,196,908 |
| 2000's | 1,395,865 | 1,478,178 | 1,321,232 | 1,354,263 | 1,252,500 | 1,282,899 | 1,010,503 | 1,200,831 | 1,026,632 | 893,208 |
| 2010's | 782,633 | 752,481 | 834,133 | 793,931 | 866,243 | 886,596 | 640,936 | 589,355 | 773,558 | 767,268 |
| 2020's | 585,159 |
| - = No Data Reported; -- = Not Applicable; NA = Not Available; W = Withheld to avoid disclosure of individual company data. |
| Release Date: 2/9/2022 |
| Next Release Date: Suspended |