|
Download Data (XLS File) |
|
|||||
|
|||||
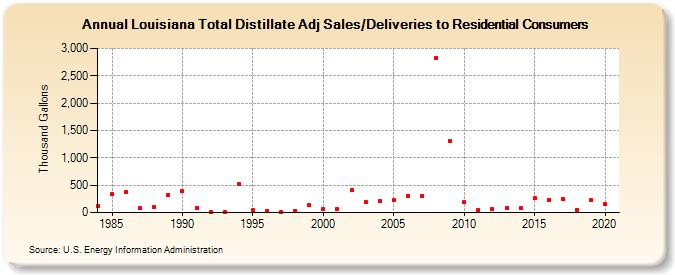
| Louisiana Total Distillate Adj Sales/Deliveries to Residential Consumers (Thousand Gallons) | |||||
| Decade | Year-0 | Year-1 | Year-2 | Year-3 | Year-4 | Year-5 | Year-6 | Year-7 | Year-8 | Year-9 |
|---|---|---|---|---|---|---|---|---|---|---|
| 1980's | 118 | 335 | 371 | 79 | 99 | 323 | ||||
| 1990's | 389 | 79 | 3 | 3 | 526 | 49 | 24 | 3 | 29 | 141 |
| 2000's | 63 | 73 | 419 | 189 | 212 | 226 | 309 | 297 | 2,830 | 1,305 |
| 2010's | 193 | 49 | 58 | 78 | 87 | 258 | 229 | 249 | 55 | 230 |
| 2020's | 151 |
| - = No Data Reported; -- = Not Applicable; NA = Not Available; W = Withheld to avoid disclosure of individual company data. |
| Release Date: 2/9/2022 |
| Next Release Date: Suspended |