|
Download Data (XLS File) |
|
|||||
|
|||||
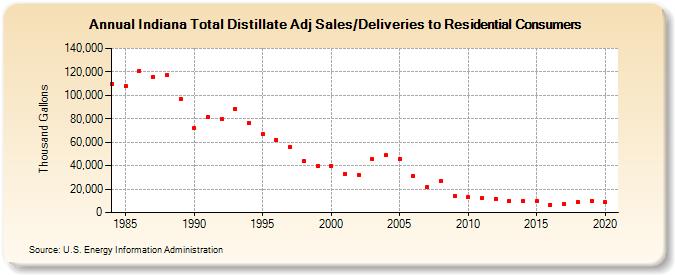
| Indiana Total Distillate Adj Sales/Deliveries to Residential Consumers (Thousand Gallons) | |||||
| Decade | Year-0 | Year-1 | Year-2 | Year-3 | Year-4 | Year-5 | Year-6 | Year-7 | Year-8 | Year-9 |
|---|---|---|---|---|---|---|---|---|---|---|
| 1980's | 109,516 | 107,673 | 121,016 | 115,985 | 117,319 | 97,159 | ||||
| 1990's | 72,029 | 81,346 | 79,704 | 88,566 | 76,644 | 67,067 | 61,655 | 56,231 | 43,583 | 40,043 |
| 2000's | 40,064 | 33,104 | 32,450 | 45,420 | 48,771 | 45,517 | 31,328 | 21,633 | 26,912 | 14,094 |
| 2010's | 12,904 | 12,556 | 11,604 | 9,842 | 9,573 | 9,488 | 6,762 | 7,241 | 9,279 | 10,191 |
| 2020's | 8,624 |
| - = No Data Reported; -- = Not Applicable; NA = Not Available; W = Withheld to avoid disclosure of individual company data. |
| Release Date: 2/9/2022 |
| Next Release Date: Suspended |