|
Download Data (XLS File) |
|
|||||
|
|||||
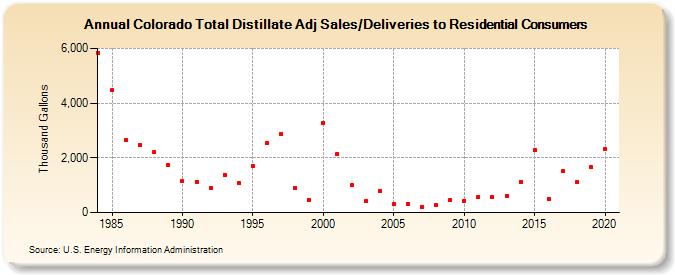
| Colorado Total Distillate Adj Sales/Deliveries to Residential Consumers (Thousand Gallons) | |||||
| Decade | Year-0 | Year-1 | Year-2 | Year-3 | Year-4 | Year-5 | Year-6 | Year-7 | Year-8 | Year-9 |
|---|---|---|---|---|---|---|---|---|---|---|
| 1980's | 5,847 | 4,471 | 2,646 | 2,481 | 2,221 | 1,753 | ||||
| 1990's | 1,140 | 1,132 | 905 | 1,386 | 1,070 | 1,699 | 2,528 | 2,878 | 889 | 469 |
| 2000's | 3,265 | 2,144 | 998 | 411 | 784 | 309 | 322 | 220 | 264 | 467 |
| 2010's | 437 | 568 | 568 | 620 | 1,134 | 2,280 | 507 | 1,513 | 1,102 | 1,650 |
| 2020's | 2,312 |
| - = No Data Reported; -- = Not Applicable; NA = Not Available; W = Withheld to avoid disclosure of individual company data. |
| Release Date: 2/9/2022 |
| Next Release Date: Suspended |