|
Download Data (XLS File) |
|
|||||
|
|||||
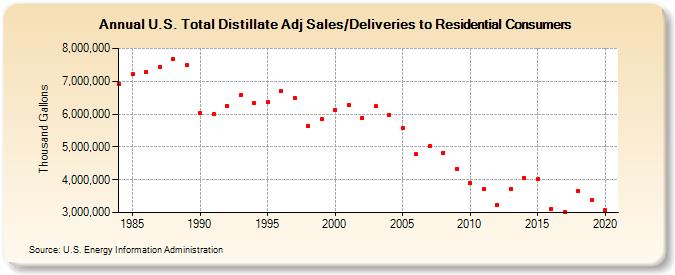
| U.S. Total Distillate Adj Sales/Deliveries to Residential Consumers (Thousand Gallons) | |||||
| Decade | Year-0 | Year-1 | Year-2 | Year-3 | Year-4 | Year-5 | Year-6 | Year-7 | Year-8 | Year-9 |
|---|---|---|---|---|---|---|---|---|---|---|
| 1980's | 6,910,211 | 7,212,897 | 7,294,815 | 7,426,412 | 7,662,046 | 7,501,098 | ||||
| 1990's | 6,022,902 | 5,993,482 | 6,238,133 | 6,577,146 | 6,335,853 | 6,370,381 | 6,707,714 | 6,487,768 | 5,633,409 | 5,847,762 |
| 2000's | 6,123,946 | 6,275,678 | 5,885,280 | 6,233,422 | 5,975,966 | 5,565,489 | 4,769,273 | 5,020,555 | 4,825,858 | 4,328,840 |
| 2010's | 3,897,937 | 3,713,883 | 3,223,851 | 3,714,150 | 4,063,924 | 4,016,064 | 3,114,687 | 3,030,245 | 3,643,279 | 3,396,535 |
| 2020's | 3,073,435 |
| - = No Data Reported; -- = Not Applicable; NA = Not Available; W = Withheld to avoid disclosure of individual company data. |
| Release Date: 2/9/2022 |
| Next Release Date: Suspended |