|
Download Data (XLS File) |
|
|||||
|
|||||
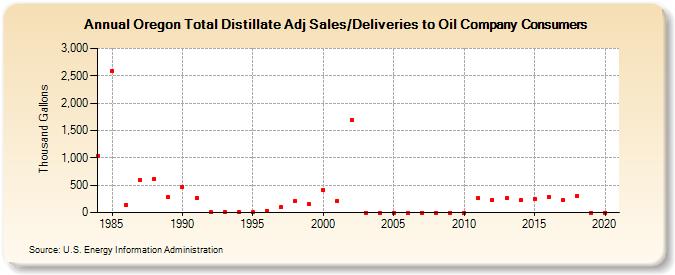
| Oregon Total Distillate Adj Sales/Deliveries to Oil Company Consumers (Thousand Gallons) | |||||
| Decade | Year-0 | Year-1 | Year-2 | Year-3 | Year-4 | Year-5 | Year-6 | Year-7 | Year-8 | Year-9 |
|---|---|---|---|---|---|---|---|---|---|---|
| 1980's | 1,039 | 2,582 | 141 | 597 | 620 | 279 | ||||
| 1990's | 476 | 267 | 3 | 19 | 2 | 3 | 34 | 94 | 213 | 151 |
| 2000's | 416 | 219 | 1,694 | 0 | 0 | 0 | 0 | 0 | 0 | 0 |
| 2010's | 0 | 265 | 237 | 260 | 222 | 256 | 293 | 226 | 304 | 0 |
| 2020's | 0 |
| - = No Data Reported; -- = Not Applicable; NA = Not Available; W = Withheld to avoid disclosure of individual company data. |
| Release Date: 2/9/2022 |
| Next Release Date: Suspended |