|
Download Data (XLS File) |
|
|||||
|
|||||
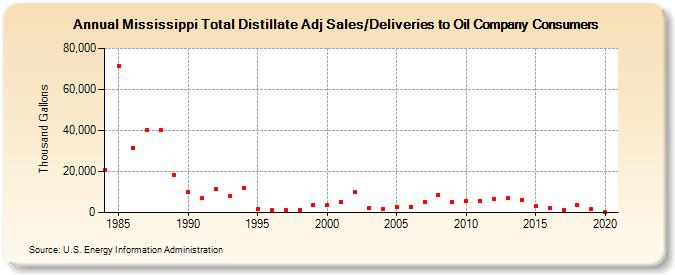
| Mississippi Total Distillate Adj Sales/Deliveries to Oil Company Consumers (Thousand Gallons) | |||||
| Decade | Year-0 | Year-1 | Year-2 | Year-3 | Year-4 | Year-5 | Year-6 | Year-7 | Year-8 | Year-9 |
|---|---|---|---|---|---|---|---|---|---|---|
| 1980's | 20,879 | 71,570 | 31,602 | 40,164 | 40,260 | 18,459 | ||||
| 1990's | 9,886 | 6,854 | 11,507 | 8,266 | 11,875 | 1,935 | 1,128 | 1,072 | 1,368 | 3,759 |
| 2000's | 3,602 | 5,216 | 9,819 | 2,102 | 1,741 | 2,922 | 2,853 | 5,213 | 8,769 | 4,979 |
| 2010's | 5,874 | 5,872 | 6,838 | 6,939 | 6,335 | 3,421 | 2,146 | 1,153 | 3,458 | 1,712 |
| 2020's | 75 |
| - = No Data Reported; -- = Not Applicable; NA = Not Available; W = Withheld to avoid disclosure of individual company data. |
| Release Date: 2/9/2022 |
| Next Release Date: Suspended |