|
Download Data (XLS File) |
|
|||||
|
|||||
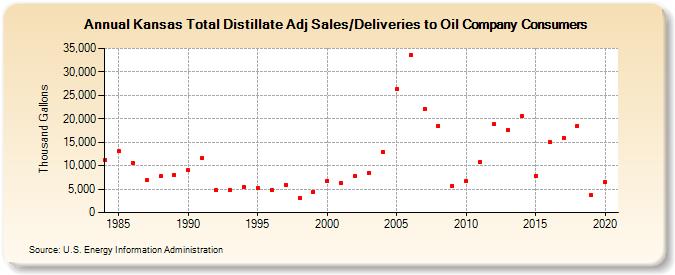
| Kansas Total Distillate Adj Sales/Deliveries to Oil Company Consumers (Thousand Gallons) | |||||
| Decade | Year-0 | Year-1 | Year-2 | Year-3 | Year-4 | Year-5 | Year-6 | Year-7 | Year-8 | Year-9 |
|---|---|---|---|---|---|---|---|---|---|---|
| 1980's | 11,218 | 13,046 | 10,656 | 6,881 | 7,730 | 8,024 | ||||
| 1990's | 8,988 | 11,652 | 4,734 | 4,824 | 5,513 | 5,156 | 4,868 | 5,975 | 3,064 | 4,480 |
| 2000's | 6,832 | 6,297 | 7,882 | 8,506 | 12,990 | 26,283 | 33,596 | 22,138 | 18,522 | 5,746 |
| 2010's | 6,622 | 10,879 | 18,854 | 17,623 | 20,598 | 7,891 | 14,991 | 15,953 | 18,489 | 3,668 |
| 2020's | 6,586 |
| - = No Data Reported; -- = Not Applicable; NA = Not Available; W = Withheld to avoid disclosure of individual company data. |
| Release Date: 2/9/2022 |
| Next Release Date: Suspended |